在 Windows 10 上运行 Elasticsearch 8.1.0
在 Window 10 上运行 Elasticsearch 的目标往往是开发。
Elasticsearch 软件包的下载路径: https://artifacts.elastic.co/downloads/elasticsearch/elasticsearch-8.1.0-windows-x86_64.zip Kibana 软件包下载路径: https://artifacts.elastic.co/downloads/kibana/kibana-8.1.0-windows-x86_64.zip
学习目标:
- 在本地模拟运行三节点 Elasticsearch 集群
- 修改 Elasticsearch 内置管理员用户 elastic 的密码
- 运行 Kibana 服务,启用内置的 Elastic Stack 监控功能
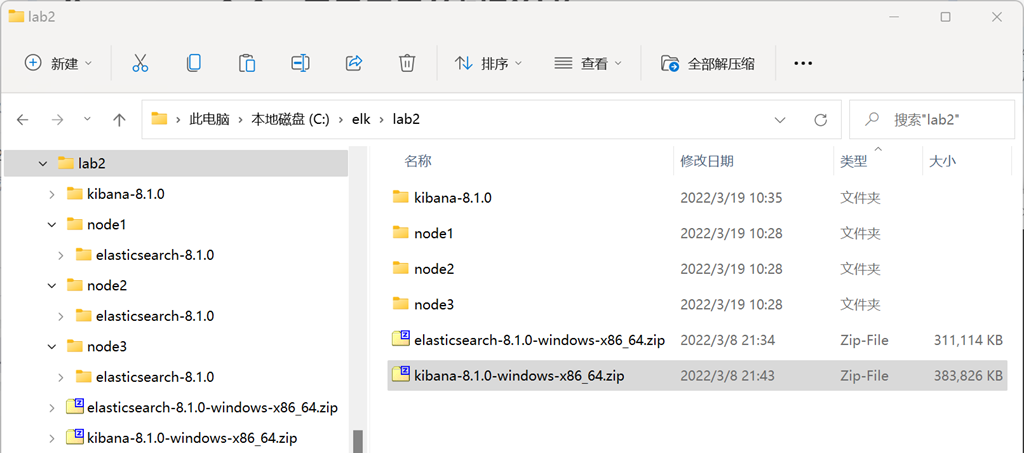
将下载的软件包放在名为 lab2 的目录中,并在这个目录中创建三个空目录:node1 、 node2 和 node3。
使用 Windows 的解压缩工具将 Elasticsearch 软件包解压缩三次,放在node1 、 node2 和 node3不同的目录中备用。将Kibana加压缩后放在 lab2 目录下。
打开一个新的Windows Terminal命令行窗口,进入 node1 的 elasticsearch-8.1.0 目录中,运行下面这条命令。
.\bin\elasticsearch.bat -E cluster.name=3m -E node.name=node1
参数解释:
- cluster.name=3m 设定集群的名称为 3m
- node.name=node1 设定本节点的名称为 node1
在以上滚动输出的日志信息中,复制粘贴类似于下面的部分到一个文本编辑器中。
------------------------------------------------------------------------------------------------------------------------
-> Elasticsearch security features have been automatically configured!
-> Authentication is enabled and cluster connections are encrypted.

->  Password for the elastic user (reset with `bin/elasticsearch-reset-password -u elastic`):
  =dU6*44bgrlnvAqptgqt

->  HTTP CA certificate SHA-256 fingerprint:
  62d0fbc0a86c0eeb6cbb7a0ffde500ea245fce6f08dfda76558c3ffe6a826cfd

->  Configure Kibana to use this cluster:
* Run Kibana and click the configuration link in the terminal when Kibana starts.
* Copy the following enrollment token and paste it into Kibana in your browser (valid for the next 30 minutes):
  eyJ2ZXIiOiI4LjEuMCIsImFkciI6WyIxNzIuMjguMTQ0LjE6OTIwMCIsIjE5Mi4xNjguMzEuMjQwOjkyMDAiXSwiZmdyIjoiNjJkMGZiYzBhODZjMGVlYjZjYmI3YTBmZmRlNTAwZWEyNDVmY2U2ZjA4ZGZkYTc2NTU4YzNmZmU2YTgyNmNmZCIsImtleSI6IlAwTVBvSDhCOVA4RmoyVl9IQUUtOjBVS0lkOWlOUmRDbU9DRi1lMWtwV0EifQ==

->  Configure other nodes to join this cluster:
* On this node:
  - Create an enrollment token with `bin/elasticsearch-create-enrollment-token -s node`.
  - Uncomment the transport.host setting at the end of config/elasticsearch.yml.
  - Restart Elasticsearch.
* On other nodes:
  - Start Elasticsearch with `bin/elasticsearch --enrollment-token <token>`, using the enrollment token that you generated.
------------------------------------------------------------------------------------------------------------------------
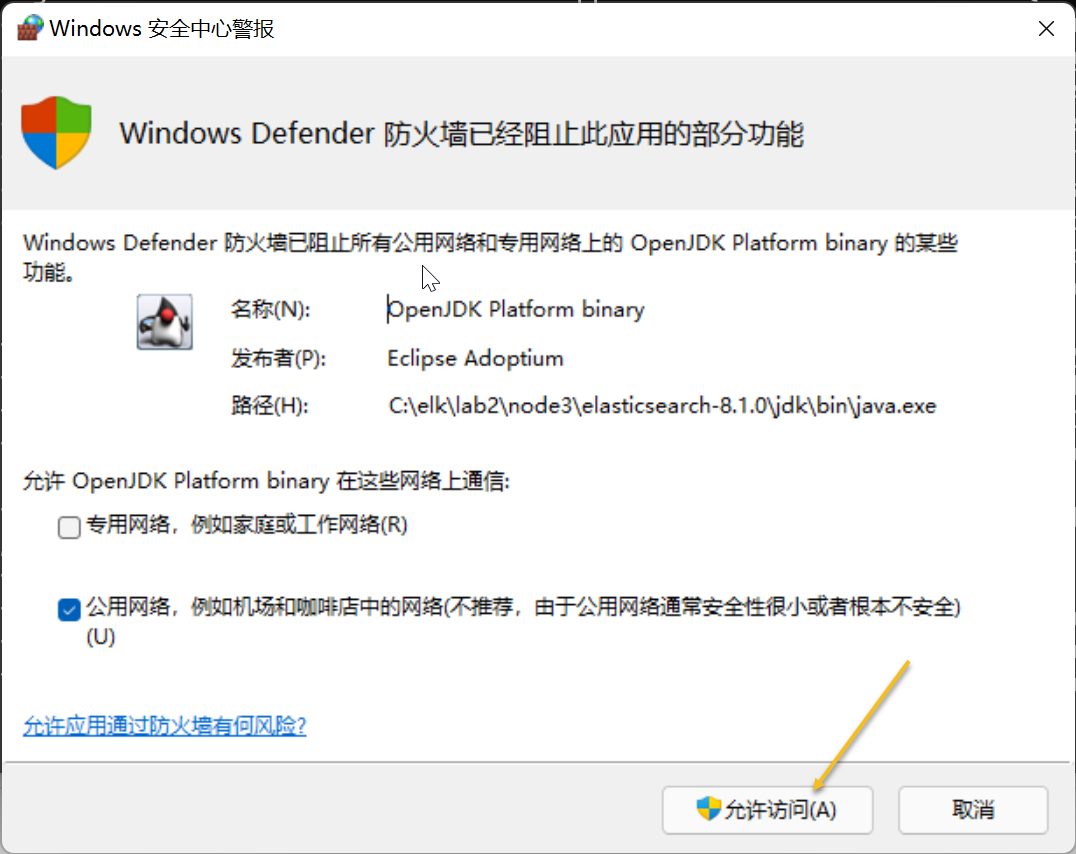
在弹出的窗口上点击“运行访问”按钮。
这样就成功的启动了 3m 集群里的首个节点,以上启动过程,完成了几件重要的系统安全保障工作。
- 为 elastic 用户创建了随机密码
- 为 Elasticsearch 集群创建了一套节点间加密传授的数字证书
- 为 Kibana 服务器创建了注册配置令牌
- 给出了其它 Elasticsearch 节点加入这个 3m 集群的操作方法
由于随机生成的用户密码不方便使用,使用下面的命令修改 elastic 用户的密码。打开一个新的 Windows Terminal 命令行窗口,进入 node1 的 elasticsearch-8.1.0/bin 目录里。
执行命令 .\elasticsearch-reset-password -u elastic -i 。
PS C:\elk\lab2\node1\elasticsearch-8.1.0\bin> .\elasticsearch-reset-password -u elastic -i
This tool will reset the password of the [elastic] user.
You will be prompted to enter the password.
Please confirm that you would like to continue [y/N]y


Enter password for [elastic]:
Re-enter password for [elastic]:
Password for the [elastic] user successfully reset.
PS C:\elk\lab2\node1\elasticsearch-8.1.0\bin>
上面就成功的修改了 elastic 用户的密码,记录该密码备用。在这个命令行窗口中运行 .\elasticsearch-create-enrollment-token -s node 命令。
PS C:\elk\lab2\node1\elasticsearch-8.1.0\bin> .\elasticsearch-create-enrollment-token -s node
eyJ2ZXIiOiI4LjEuMCIsImFkciI6WyIxOTIuMTY4LjMxLjI0MDo5MjAwIiwiMTcyLjI4LjE0NC4xOjkyMDAiXSwiZmdyIjoiNjJkMGZiYzBhODZjMGVlYjZjYmI3YTBmZmRlNTAwZWEyNDVmY2U2ZjA4ZGZkYTc2NTU4YzNmZmU2YTgyNmNmZCIsImtleSI6IlFFTVhvSDhCOVA4RmoyVl9hZ0czOml3ck9wMEJxUzBteXJxVEJLM1pVUUEifQ==
PS C:\elk\lab2\node1\elasticsearch-8.1.0\bin>
在上面的命令行输出信息中,复制所产生的集群加群令牌,备用。
修改首个节点 node1 的配置文件,在 node1 目录中,用编辑器打开配置文件 config/elasticsearch.yml ,搜索到 transport.host 这个参数所在的行,将本行的注释取消。回到 node1 的 Elasticsearch 服务启动的命令行窗口中,按 ctrl + c 停止 Elasticsearch 服务,然后再次启动该节点。
# Allow other nodes to join the cluster from localhost and local networks
# Connections are encrypted and mutually authenticated
transport.host: [_local_, _site_]
打开新的Windows Terminal命令行窗口,进入 lab2 目录,解压缩 Kibana 软件包,进入 Kibana 目录,然后启动 Kibana 服务器。
PS C:\elk\lab2> cd .\kibana-8.1.0\
PS C:\elk\lab2\kibana-8.1.0> ls


    目录: C:\elk\lab2\kibana-8.1.0


Mode                 LastWriteTime         Length Name
----                 -------------         ------ ----
d-----          2022/3/3     14:49                bin
d-----          2022/3/3     14:49                config
d-----          2022/3/3     14:49                data
d-----          2022/3/3     14:49                logs
d-----          2022/3/3     14:49                node
d-----          2022/3/3     14:49                node_modules
d-----          2022/3/3     14:49                plugins
d-----          2022/3/3     14:49                src
d-----          2022/3/3     14:49                x-pack
------          2022/3/3     14:49           4144 .i18nrc.json
------          2022/3/3     14:49           3860 LICENSE.txt
------          2022/3/3     14:49        1417101 NOTICE.txt
------          2022/3/3     14:49            738 package.json
------          2022/3/3     14:49           3966 README.txt


PS C:\elk\lab2\kibana-8.1.0> .\bin\kibana.bat
[2022-03-19T11:03:06.541+08:00][INFO ][plugins-service] Plugin "metricsEntities" is disabled.
[2022-03-19T11:03:06.632+08:00][INFO ][http.server.Preboot] http server running at http://localhost:5601
[2022-03-19T11:03:06.697+08:00][INFO ][plugins-system.preboot] Setting up [1] plugins: [interactiveSetup]
[2022-03-19T11:03:06.700+08:00][INFO ][preboot] "interactiveSetup" plugin is holding setup: Validating Elasticsearch connection configuration…
[2022-03-19T11:03:06.734+08:00][INFO ][root] Holding setup until preboot stage is completed.


i Kibana has not been configured.

Go to http://localhost:5601/?code=813984 to get started.
在 Kibana 服务器正常启动之后,打开一个浏览器,输入 Kibana 的访问地址:http://localhost:5601/?code=813984;在 Kibana 的首次登陆配置界面中粘贴入 node1 节点首次启动时所生成的 Kibana 注册令牌,然后点击 ”Configure Elastic“ 按钮。等待 Kibana 配置完毕之后,使用 elastic 用户登录 Kibna。
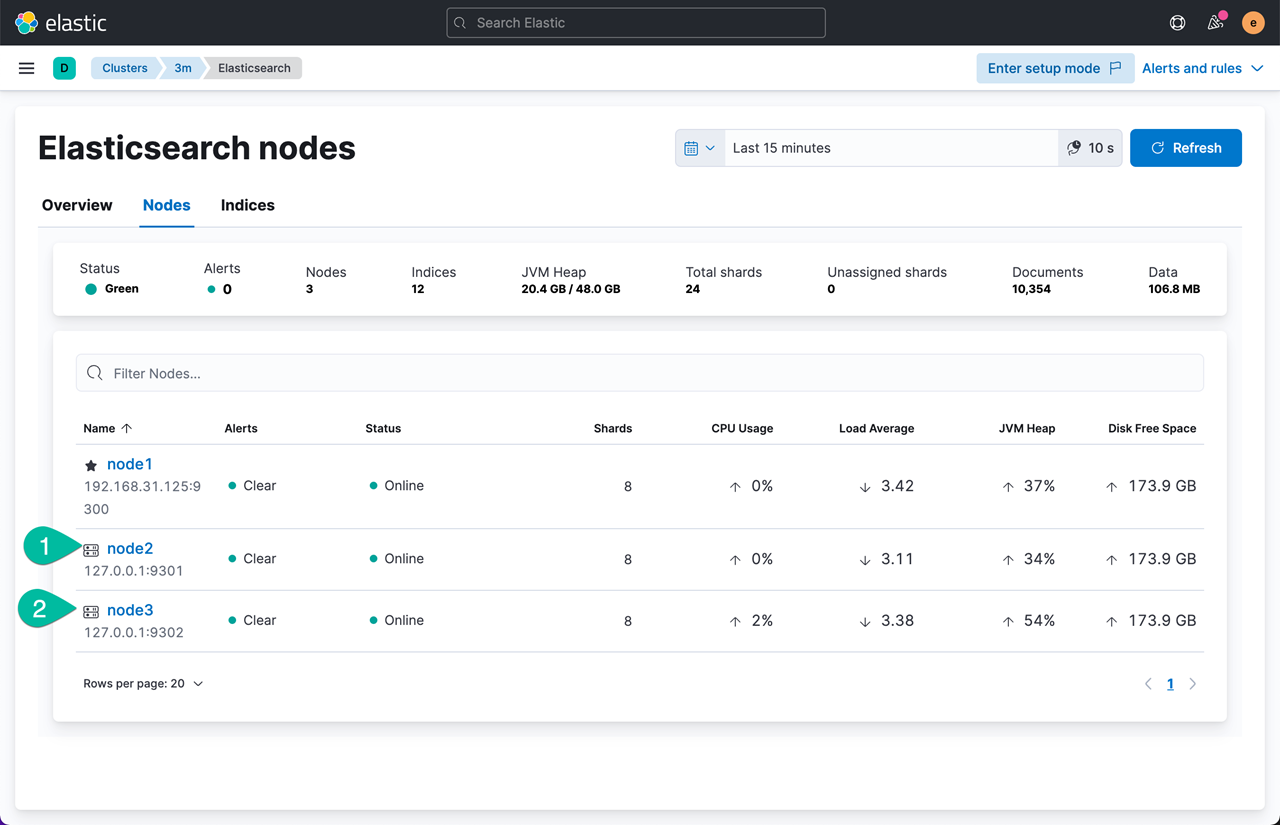
在 Kibana 左侧菜单中,点击 Management -> Stack Montitoring ,选择启用集群自监控功能。【点击选择 –》 Or, set up with self monitoring】;然后进入 3m 集群的节点监控界面。如下图所示。
【下面的练习是可选操作,以上已经完成了 Elasticsearch 和 Kibna的基础搭建。】 Elasticsearch 是一个分布式搜索系统,执行后续的操作是在一个操作系统内,模拟3节点对等集群的操作。
下面开始模拟 node2 和 node3 加入 3m 集群。
打开新的Windows Terminal命令行窗口,进入 node2 的 elasticsearch-8.1.0 目录中。执行下面的命令,注意这里所使用的 token 是上面的命令所生成的。
.\bin\elasticsearch.bat -E cluster.name=3m -E node.name=node2 --enrollment-token eyJ2ZXIiOiI4LjEuMCIsImFkciI6WyIxOTIuMTY4LjMxLjI0MDo5MjAwIiwiMTcyLjI4LjE0NC4xOjkyMDAiXSwiZmdyIjoiNjJkMGZiYzBhODZjMGVlYjZjYmI3YTBmZmRlNTAwZWEyNDVmY2U2ZjA4ZGZkYTc2NTU4YzNmZmU2YTgyNmNmZCIsImtleSI6IlFFTVhvSDhCOVA4RmoyVl9hZ0czOml3ck9wMEJxUzBteXJxVEJLM1pVUUEifQ==
命令执行的过程如下:
PS C:\elk\lab2\node2\elasticsearch-8.1.0> .\bin\elasticsearch.bat  -E cluster.name=3m -E node.name=node2   --enrollment-token  eyJ2ZXIiOiI4LjEuMCIsImFkciI6WyIxOTIuMTY4LjMxLjI0MDo5MjAwIiwiMTcyLjI4LjE0NC4xOjkyMDAiXSwiZmdyIjoiNjJkMGZiYzBhODZjMGVlYjZjYmI3YTBmZmRlNTAwZWEyNDVmY2U2ZjA4ZGZkYTc2NTU4YzNmZmU2YTgyNmNmZCIsImtleSI6IlFFTVhvSDhCOVA4RmoyVl9hZ0czOml3ck9wMEJxUzBteXJxVEJLM1pVUUEifQ==
[2022-03-19T11:13:23,617][INFO ][o.e.n.Node               ] [node2] version[8.1.0], pid[20036], build[default/zip/3700f7679f7d95e36da0b43762189bab189bc53a/2022-03-03T14:20:00.690422633Z], OS[Windows 11/10.0/amd64], JVM[Eclipse Adoptium/OpenJDK 64-Bit Server VM/17.0.2/17.0.2+8]
[2022-03-19T11:13:23,624][INFO ][o.e.n.Node               ] [node2] JVM home [C:\elk\lab2\node2\elasticsearch-8.1.0\jdk], using bundled JDK [true]
[2022-03-19T11:13:23,625][INFO ][o.e.n.Node               ] [node2] JVM arguments [-Des.networkaddress.cache.ttl=60, -Des.networkaddress.cache.negative.ttl=10, -Djava.security.manager=allow, -XX:+AlwaysPreTouch, -Xss1m, -Djava.awt.headless=true, -Dfile.encoding=UTF-8, -Djna.nosys=true, -XX:-OmitStackTraceInFastThrow, -XX:+ShowCodeDetailsInExceptionMessages, -Dio.netty.noUnsafe=true, -Dio.netty.noKeySetOptimization=true, -Dio.netty.recycler.maxCapacityPerThread=0, -Dio.netty.allocator.numDirectArenas=0, -Dlog4j.shutdownHookEnabled=false, -Dlog4j2.disable.jmx=true, -Dlog4j2.formatMsgNoLookups=true, -Djava.locale.providers=SPI,COMPAT, --add-opens=java.base/java.io=ALL-UNNAMED, -XX:+UseG1GC, -Djava.io.tmpdir=C:\Users\liuma\AppData\Local\Temp\elasticsearch, -XX:+HeapDumpOnOutOfMemoryError, -XX:+ExitOnOutOfMemoryError, -XX:HeapDumpPath=data, -XX:ErrorFile=logs/hs_err_pid%p.log, -Xlog:gc*,gc+age=trace,safepoint:file=logs/gc.log:utctime,pid,tags:filecount=32,filesize=64m, -Xms16329m, -Xmx16329m, -XX:MaxDirectMemorySize=8564768768, -XX:InitiatingHeapOccupancyPercent=30, -XX:G1ReservePercent=25, -Delasticsearch, -Des.path.home=C:\elk\lab2\node2\elasticsearch-8.1.0, -Des.path.conf=C:\elk\lab2\node2\elasticsearch-8.1.0\config, -Des.distribution.flavor=default, -Des.distribution.type=zip, -Des.bundled_jdk=true]
[2022-03-19T11:13:28,838][INFO ][o.e.p.PluginsService     ] [node2] loaded module [aggs-matrix-stats]
[2022-03-19T11:13:28,838][INFO ][o.e.p.PluginsService     ] [node2] loaded module [analysis-common]
[2022-03-19T11:13:28,839][INFO ][o.e.p.PluginsService     ] [node2] loaded module [constant-keyword]
[2022-03-19T11:13:28,839][INFO ][o.e.p.PluginsService     ] [node2] loaded module [data-streams]
[2022-03-19T11:13:28,839][INFO ][o.e.p.PluginsService     ] [node2] loaded module [frozen-indices]
[2022-03-19T11:13:28,840][INFO ][o.e.p.PluginsService     ] [node2] loaded module [ingest-common]
打开新的Windows Terminal命令行窗口,进入 node3 的 elasticsearch-8.1.0 目录中。执行下面的命令,注意这里所使用的 token 是上面的命令所生成的。
.\bin\elasticsearch.bat -E cluster.name=3m -E node.name=node3 --enrollment-token eyJ2ZXIiOiI4LjEuMCIsImFkciI6WyIxOTIuMTY4LjMxLjI0MDo5MjAwIiwiMTcyLjI4LjE0NC4xOjkyMDAiXSwiZmdyIjoiNjJkMGZiYzBhODZjMGVlYjZjYmI3YTBmZmRlNTAwZWEyNDVmY2U2ZjA4ZGZkYTc2NTU4YzNmZmU2YTgyNmNmZCIsImtleSI6IlFFTVhvSDhCOVA4RmoyVl9hZ0czOml3ck9wMEJxUzBteXJxVEJLM1pVUUEifQ==
在 Elastic Stack 集群自监控界面上,确认 3m 集群里所加入的两个新的节点。